
Why Kesteven
Built for people who make decisions with their own money
Kesteven exists to give independent investors and gig-economy professionals the same quality of structured data and process discipline that institutional desks rely on — without the jargon or the gatekeeping.
- Approach
- Data-first, not opinion-first
- Audience
- Independent investors & gig professionals
- Output
- Structured, repeatable, reviewable
Most tools are built for someone else's workflow
Generic trading platforms and spreadsheet templates are designed around whoever built them first — not around how you actually work, earn, or make decisions.
- Dashboards built for analysts, not for you Dense terminals assume a team behind them. You're working alone, between other commitments.
- Advice without a visible process Signals and tips arrive with no explanation of how they were reached or what assumptions sit underneath them.
- One-size-fits-all reporting Irregular income, variable hours, and self-directed decisions get treated as edge cases instead of the norm.
Kesteven was shaped around a simpler idea: give people a clear, structured view of their own data, and let them decide what to do with it. No black boxes, no borrowed assumptions.
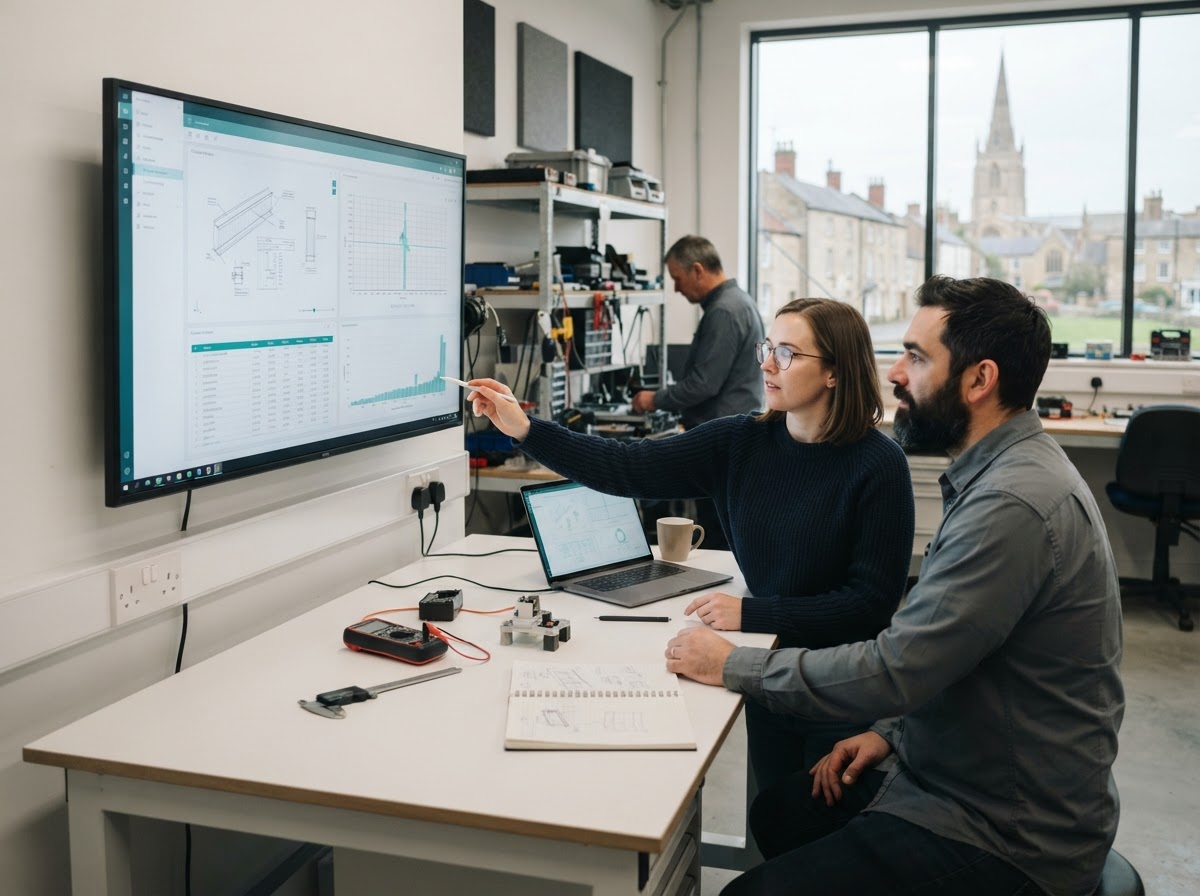
A process you can see, question, and repeat
Every figure, grouping, and flag inside Kesteven traces back to a defined method — not a hidden model. That matters when the decisions being made are yours, and the consequences are yours too.
We built Kesteven around three commitments: keep the underlying logic visible, keep the interface usable without a training manual, and keep the output consistent enough that you can trust the same process tomorrow as you did today.
This isn't a promise of certainty — markets and income are inherently variable. It's a commitment to clarity about what the data shows and how it was arrived at.
What actually makes the difference
Four areas where Kesteven is deliberately different from a generic analytics tool.
Transparent methodology
Each report states what was measured, over what period, and under what conditions — not just a headline number.
Built for irregular patterns
Variable income and non-standard schedules are treated as a normal input, not a complication the system wasn't designed for.
No bundled advice
We present structured data and context. The interpretation and the decision stay with you, where they belong.
Consistent, reviewable output
Reports follow the same structure each time, so comparing this month to last month is straightforward rather than guesswork.
How we approach every engagement
The same three-stage process underpins everything Kesteven produces, regardless of the question being asked.
-
1
Define the question
We start by establishing exactly what's being measured and why, so the output answers something you actually need to know.
-
2
Structure the data
Inputs are organised against a consistent framework, flagged for anomalies, and prepared for review rather than left raw.
-
3
Present it plainly
The result is delivered in a format designed to be read and acted on quickly — not buried in unnecessary complexity.
Who Kesteven is built for
Two groups, two different sets of pressures, one shared need for clear, structured data.
Independent investors
Managing your own portfolio without a research desk behind you means every decision rests on data you have to interpret yourself. Kesteven focuses on making that data legible — organised, contextualised, and consistent — so judgment calls are made on solid ground rather than fragments.
What this looks like
- Structured performance views over defined periods
- Clear separation between raw data and interpretation
- Consistent formatting for easier period comparison
Gig-economy professionals
Variable hours and fluctuating income make standard financial tools feel disconnected from reality. Kesteven treats irregularity as the baseline, not an exception, giving you a steadier read on patterns that actually reflect how you work.
What this looks like
- Income pattern views built for non-standard schedules
- Flags for unusual swings without false alarms
- Reports you can scan between jobs, not just at a desk
See the difference in your own data
Access the Kesteven data suite and judge the process for yourself — on your terms, with your own figures.
Access Data SuiteKesteven provides structured data and analysis tools. Nothing on this page constitutes financial, investment, or tax advice, and all decisions remain the responsibility of the individual.